- Established in 1974
- Singapore - Korea - China - Malaysia - Vietnam
United Arab Emirates - Azerbaijan - United Kingdom
![]() Note: Files are in Adobe (PDF) format.
Note: Files are in Adobe (PDF) format.
Please download the free Adobe Acrobat Reader to view these documents.
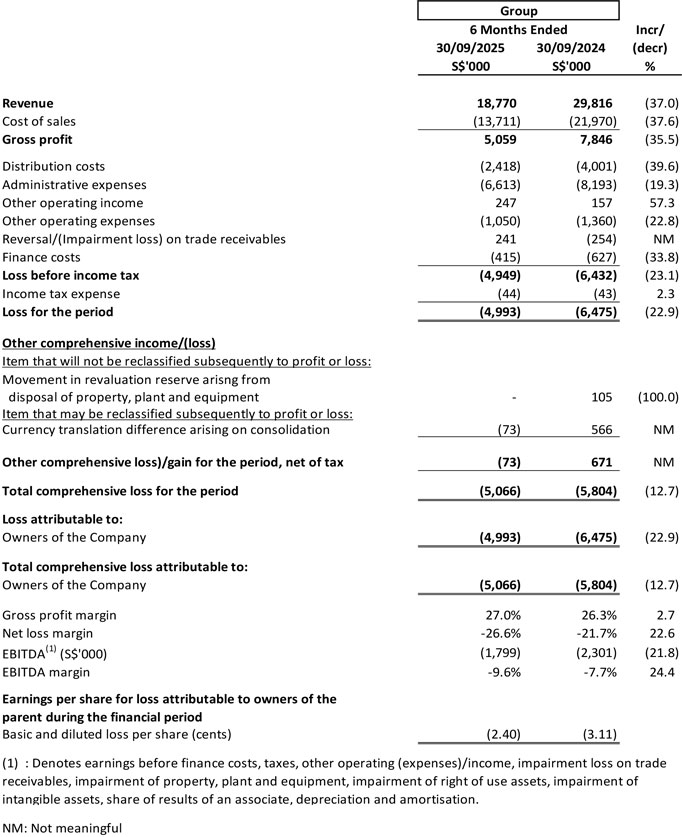
Revenue
1H FY2026 vs 1H FY2025
For 6 months ended 30 September 2025 ("1H FY2026"), the Group's revenue was S$18.8 million, a decrease of S$11.0 million or 37.0% from S$29.8 million for the corresponding period ended 30 September 2024 ("1H FY2025").
Gross profit
1H FY2026 vs 1H FY2025
The Group reported gross profit of S$5.1 million in 1H FY2026, a decrease of S$2.7 million or 35.5% from a gross profit of S$7.8 million in 1H FY2025. Gross profit margin increased from 26.3% in 1H FY2025 to 27.0% in 1H FY2026.
Distribution costs
1H FY2026 vs 1H FY2025
Distribution costs decreased by S$1.6 million or 40.0% from S$4.0 million in 1H FY2025 to S$2.4 million in 1H FY2026.
Administrative expenses
1H FY2026 vs 1H FY2025
Administrative expenses decreased by S$1.6 million or 19.3% from S$8.2 million in 1H FY2025 to S$6.6 million in 1H FY2026.
Other operating income
1H FY2026 vs 1H FY2025
Other Operating income maintains at S$0.2 million in 1H FY2026 as against 1H FY2025.
Other operating income included rental income, interest income, sundry income, government grants and net foreign exchange gain.
Other operating expenses
1H FY2026 vs 1H FY2025
Other operating expenses decreased by S$0.3 million to S$1.1 million in 1H FY2026.
Impairment loss on trade receivables
1H FY2026 vs 1H FY2025
Reversal of impairment loss on trade receivables was S$0.2 million in 1H FY2026 as compared to an impairment loss of S$0.3 million in 1H FY2025 based on a review of trade receivables performed on 30 September 2025.
Finance cost
1H FY2026 vs 1H FY2025
Finance cost in 1H FY2026 decreased by S$0.2 million or 33.8% from S$0.6 million in 1H FY2025 to S$0.4 million in 1H FY2026 due to repayment of borrowings in 1H FY2026.
Loss for the period
1H FY2026 vs 1H FY2025
In 1H FY2026, the Group reported a loss before income tax of S$4.9 million, a decrease of S$1.5 million or 23.1% from the loss before income tax of S$6.4 million in 1H FY2025. This decrease in the loss before income tax was mainly due to (i) decrease in distribution costs of $1.6 million, (ii) administrative expenses of S$1.6 million, (iii) other operating expenses of S$0.3 million, (iv) finance costs of S$0.2 million, and (v) reversal of impairment loss on trade receivables by S$0.5 million, offset by a decrease in gross profit of S$2.7 million.
Total comprehensive loss for the period
1H FY2026 vs 1H FY2025
Total comprehensive loss for 1H FY2026 was S$5.1 million compared to S$5.8 million for 1H FY2025. This mainly arises from a loss after tax of S$5.1 million in 1H FY2026.
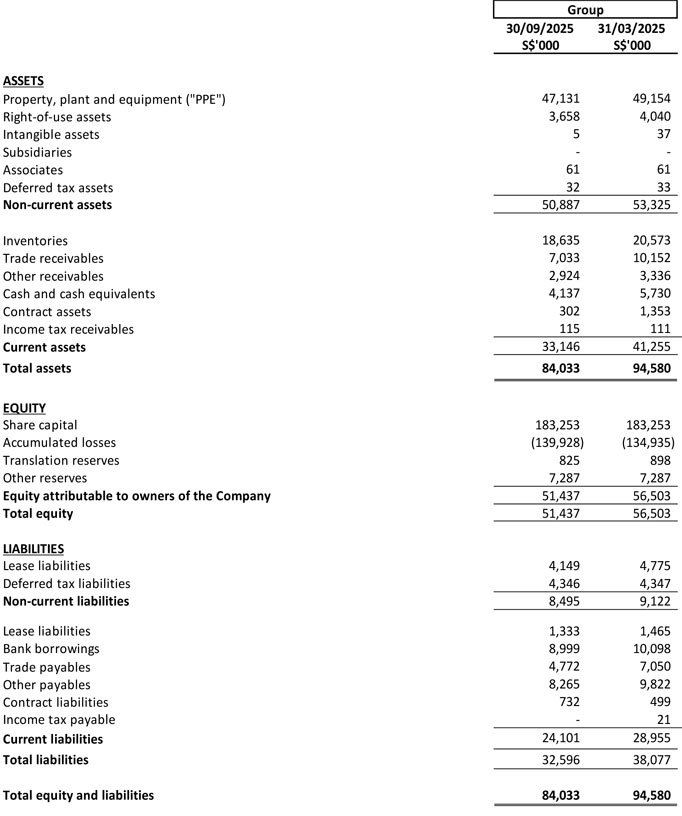
Current assets
Current assets at the Group level decreased by S$8.2 million or 19.9% from S$41.3 million as at 31 March 2025 to S$33.1 million as at 30 September 2026 mainly due to: (i) a decrease in inventories by S$2.0 million, (ii) a decrease in trade receivables of S$3.2 million, and (iii) a decrease in cash and cash equivalents of S$1.6 million, (iv) a decrease in contract assets of S$1.0 million, and (v) a decrease in other receivables of $0.4 million.
Current assets at the Company level decreased by S$0.6 million or 20.0% mainly due to: (i) a decrease in trade and other receivables of S$0.1 million; and (ii) a decrease in contract assets of S$0.5 million.
Non-current assets
Non-current assets at the Group level decreased by S$2.4 million or 4.5% from S$53.3 million as at 31 March 2025 to S$50.9 million as at 30 September 2025. The decrease was mainly due to (i) a decrease of S$2.0 million in property, plant and equipment and (ii) a decrease of S$0.4 million in right-of-use assets.
Non-current assets at the Company level as at 30 September 2025 increased by S$3.8 million or 2.4% from S$157.5 million as at 31 March 2025 to S$161.3 million as 30 September 2025 mainly due to increased receivables from subsidiaries.
Current liabilities
Current liabilities at the Group level decreased by S$4.9 million or 16.9% from S$29.0 million as at 31 March 2025 to S$24.1 million as at 30 September 2025. The decrease was mainly due to: (i) repayment of S$1.1 million in bank borrowings; and (ii) a decrease of S$3.8 million in trade and other payables.
Other Payables of S$8.3 million as at 30 September 2025 at the Group level comprise::
Other Payables of S$9.8 million as at 31 March 2025 at the Group level comprise:
Current liabilities at the Company level increased by S$2.5 million or 39.1% from S$ 6.4 million as at 31 March 2025 to S$8.9 million as at 30 September 202 5. The increase was mainly due to the receipt of additional short-term advances received from related company of the Company.
Non-current liabilities
Non-current liabilities at the Group level decreased by S$0.6 million or 6.6% from S$9.1 million as at 31 March 2025 to S$8.5 million as at 30 September 2025. The decrease was mainly due to repayment of S$0.6 million in lease liabilities.
Capital, reserves and non-controlling interests
Shareholders' equity decreased by S$5.1 million or 9.0% from S$56.5 million as at 31 March 2025 to S$51.4 million as at 30 September 2025, mainly due to total comprehensive loss of S$5.1 million suffered in 1H2026.
The cash and cash equivalents at 30 September 2025 decreased by S$1.6 million or 28.1% from S$ 4.7 million as at 31 March 2025 to S$3.1 million as at 30 September 2025.
Net cash (used in)/generated from operating activities
Net cash of S$1.2 million was generated in operating activities in 1H FY2026 as compared to net cash of S$1.1 million used in operating activities in 1H FY2025. Net cash used in operating cash before changes in working capital in 1H FY2026 was S$2.0 million, as compared to net cash used of S$1.8m in 1H FY2025.
Net working capital inflow was S$3.3 million in 1H FY2026 as compared to a net working capital inflow of S$0.8million in 1H FY2025. The net working capital inflow in 1H FY2026 was mainly contributed by: (i) a decrease in trade and other receivables of S$2.5 million due to collection from customers; (ii) a decrease in inventory of S$1.9 million resulting from efforts to reduce inventory; (iii) a decrease in contract assets of S$1.0 million, (iv) an increase in contract liabilities of S$0.2 million, and (v) a decrease in trade and other payables of S$2.4 million mainly due to lower payments made to suppliers.
Net cash generated from/(used in) investing activities
Net cash of S$0.4 million was generated from investing activities in 1H FY2026 as compared to net cash generation of S$4.5 million in 1H FY2025. This was mainly due to S$0.8 million in proceeds from the disposal of property, plant and equipment, offset by S$0.4 million in purchase of plant and equipment in 1H 2026.
Net cash used in financing activities
Net cash used in financing activities was S$2.0 million in 1H FY2026 as compared to S$5.9 million in 1H FY2025. This was mainly due to: (i) repayment of bank borrowings, including interest of S$1.3 million; (ii) repayment of lease liabilities and lease liability interest of S$1.0 million; offset by decrease in restricted cash at bank of S$0.3 million.
AMOS Group Limited (“AMOS) is a long-established supplier of products and service to energy and shipping customers from facilities operating in Asia, the Middle East, and Europe. The business prospects for AMOS are impacted by shifts in the global trade of goods as well as the development of current and existing energy resources.
The Group is focusing efforts to drive sales and streamline costs to meet its financial obligations.